Nouméa
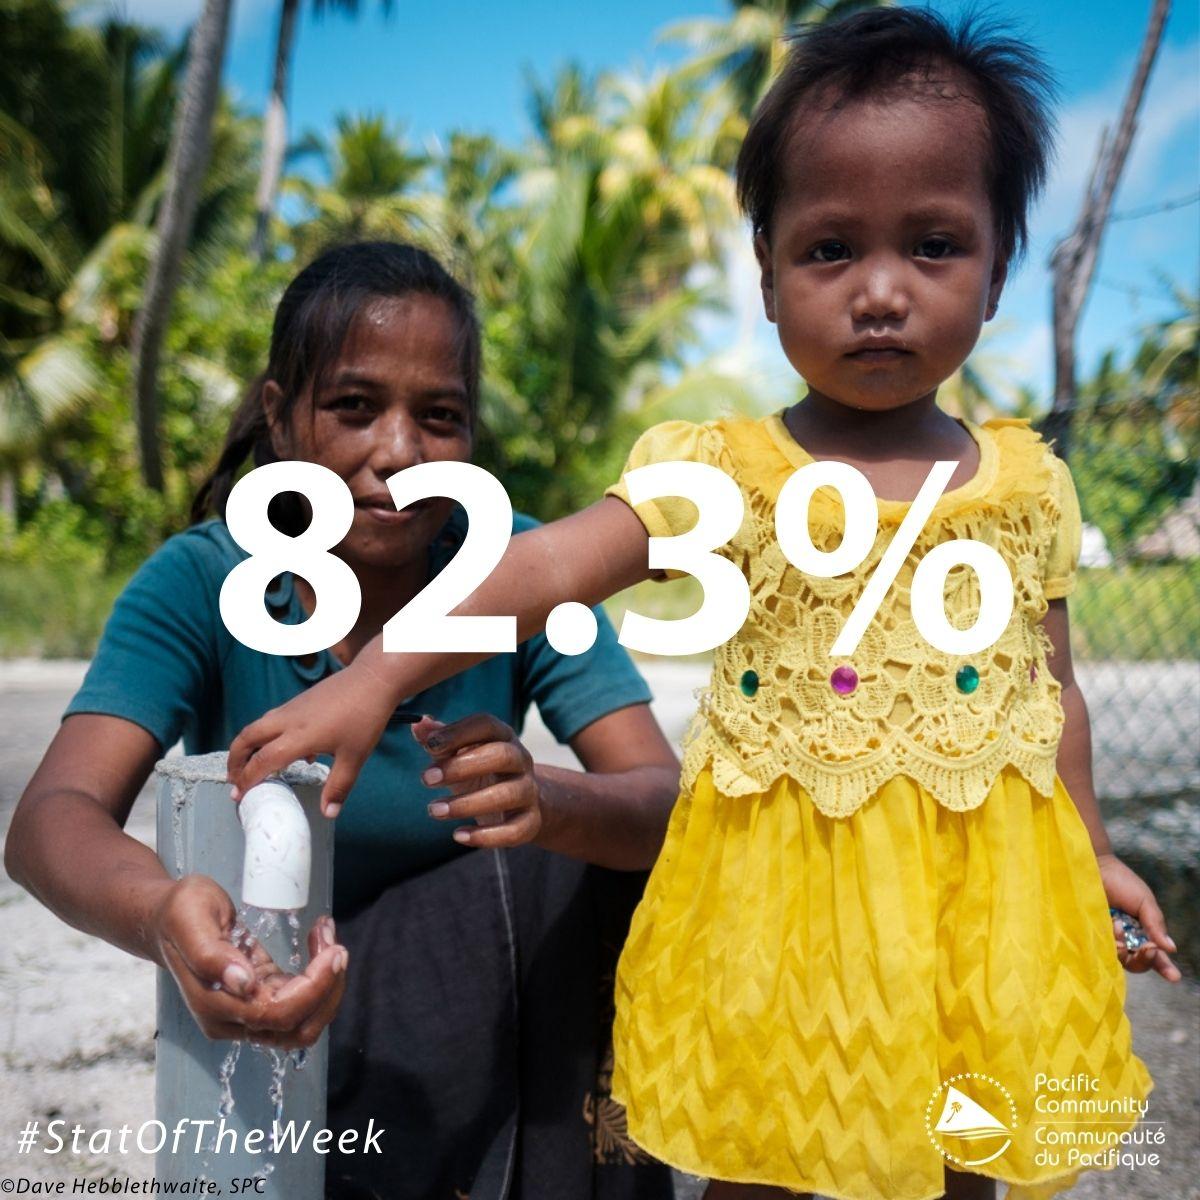
Ces dernières décennies, des progrès ont été accomplis pour améliorer l’accès à l’eau : 82,3 % de la population de Kiribati a accès à un service d’approvisionnement en eau de meilleure qualité, mais seuls 17 % des habitants bénéficient d’une eau non contaminée.
Source : (Kiribati 2018-19 MICS)
| Pacific Island Countries and territories | 6.1.1 Population using an improved drinking water source | 6.1.1 Population using safely managed drinking water services | 6.2.1 Population practicing open defecation | 6.2.1 Population with basic handwashing facilities on premises | 6.2.1 Population using improved sanitation services | 6.2.1 Population using safely managed sanitation services | 6.3.1 Proportion of wastewater safely treated |
|---|---|---|---|---|---|---|---|
| American Samoa | 89.85% | 36.99% | 69% | ||||
| Cook Islands | 99.9% | 99.97% | 0.48% | ||||
| Fiji | 98% | 95.49% | 0% | 86.53% | 96% | 48.79% | 36% |
| Micronesia (Federated States of) | 85.7% | 90.11% | 9.5% | 81% | |||
| Kiribati | 82.3% | 75.69% | 32.75% | 55.68% | 60.6% | 24.79% | 30.8% |
| Marshall Islands | 98.8% | 85.06% | 8.68% | 85.09% | 76% | ||
| Northern Mariana Islands | 90.64% | ||||||
| New Caledonia | 97.07% | 96.87% | 100% | ||||
| Nauru | 97.5% | 100% | 2.59% | 78.7% | |||
| Niue | 96.3% | 97.01% | 0.5% | 99.6% | |||
| French Polynesia | 100% | 81.81% | 96.3% | ||||
| Papua New Guinea | 39.6% | 50.24% | 16.1% | 29.86% | 18.9% | ||
| Palau | 99% | 99.57% | 0% | 99.6% | |||
| Solomon Islands | 82.5% | 67.45% | 44.55% | 38.64% | 30.7% | ||
| Tonga | 91.7% | 98.81% | 0.09% | 69.54% | 99.8% | 32.05% | 28.6% |
| Tuvalu | 99.9% | 99.26% | 2.62% | 93.96% | 97% | 37.23% | 2% |
| Vanuatu | 90% | 91.34% | 0.06% | 75.88% | 52% | ||
| Wallis and Futuna | 68.88% | ||||||
| Samoa | 97.3% | 99.04% | 0.13% | 71.96% | 97% | 42.93% | 46.7% |
Blog Category
Le saviez-vous ?
Division
Statistique pour le développement