
What do users want?
What do users really want or need? This is a question that all service providers, including the Statistics for Development Division (SDD) of SPC – and SPC at large – should ask themselves.
In the case of SDD, which aims to “strengthen access to and use of statistics in policy development and monitoring progress”, the question is: what do national planners, policy-makers, academics, consultants, NGOs, CROP agencies, and the general public want that will allow them to make informed decisions?
In September/October 2017, SDD undertook a User Focus Survey with financial support from the MFAT of New Zealand. The conduct of this survey leveraged experience gained from similar work previously undertaken by Statistics New Zealand. The results of SDD’s user survey is now guiding redevelopment of SDD’s web presence, analysis and dissemination strategy.
The survey was conducted through direct emails sent to the CRGA sub-committee, and through an on-line survey tool. In total sixty-nine responses were received, and fourteen of these were followed-up with skype/phone interviews. The survey focussed on identifying who were SDD’s main customers; what were their needs for statistics or statistical services; how did SDD’s existing product mix meet these needs; and what were the gaps that needed to be filled in order to offer customers a better range of statistical products and services.
Who were our respondents…
Around two-thirds of the respondents were from a Pacific Island Country of Territory, 12% from each of Australia and New Zealand, and 9% from the rest of the world. The largest proportion (39%) of the respondents came from international and regional (including CROP) development agencies followed by national statistics offices and university or other research institutions (19% each), government ministries and departments including planning, health and education agencies (12%) with the balance comprising civil society, the private sector and CSOs. At the individual level the biggest group of respondents were advisors/specialists (just over one third of respondents) with Directors/CEOs, Division/Department Heads and technical officers, all of whom from a Pacific Island or Territory, making up about one third of respondents. The remaining respondents were primarily university staff and students.
It was a little disappointing that few respondents came from in-country statistical or policy counterparts and the next iteration of the survey will aim to have heavier emphasis on reaching these staff within governments.
…and what we learnt from them
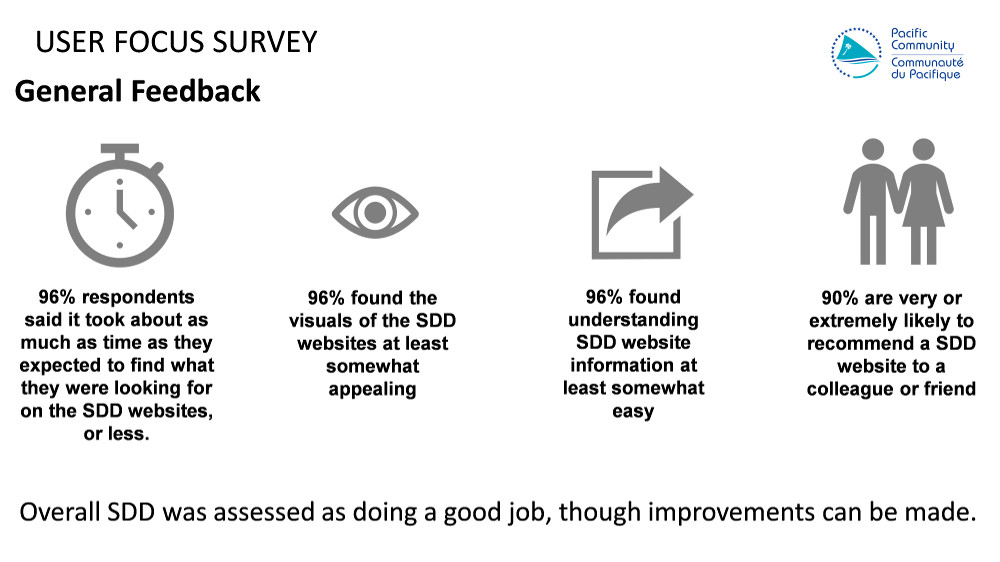
About 40% of respondents indicated using the SDD website at least once a week, with just over 40% indicating use of the SDD statistics web-site about once per month.
But what did they expect? Firstly, we need to think like a user; no complex terminology – keep-it-as-simple-as possible consistent with the need to maintain the integrity of the data; build our services to be accessible and user-friendly for the least experienced users; acknowledge that our users have a range of different goals and understand what these are. This means we need to structure our statistics products and services according to the key topics as understood by users, and not necessarily how we, as economic or social statisticians and demographers, might understand or compile the data. For example, we need to think “Poverty/Hardship/Consumption/Expenditure” and not HIES analysis, or “Births/Deaths” and not Civil Registration and Vital Statistics (CRVS).
Users also wanted our website and products to be data-centric, well documents with appropriated meta-data and presented in a clean, simple and accessible way.
What are we going to do better?
As a result of our better understanding of our customers’ needs, we are going to improve the way we present our statistical products and services:
- More user-focused data and information dissemination,
- Improved access to statistics and databases to facilitate better analysis and utilisation of data; leading to better evidence-based policy development/decision making,
- Interoperability of relevant Pacific datasets to aid in reporting on development indicators (i.e. SDGs),
- Provision of real-time population data for disaster assistance/relief
Where will this Lead Us?
- We want to make SDD(SPC) to be the first port of call for statistics in the Pacific
- We are reshaping our dissemination strategies and improving our work on data analysis and dissemination in SDD.
- We will be undertaking follow-up user focus surveys on an annual/bi-annual basis (funds permitting), and our next iteration will have a stronger emphasis on our in-country counterparts in NSOs and in planning and policy agencies at the national level.
Contact:
David Abbott, Manager, Data Analysis and Dissemination, Statistics for Development Division, Pacific Community (SPC), [email protected]