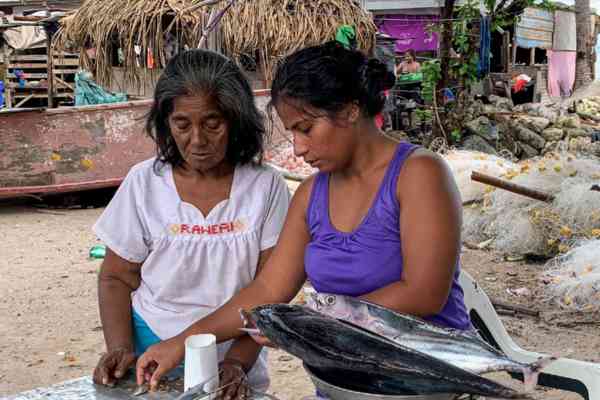
Tuna, in both cooked and raw forms, is found on restaurant menus, in sandwiches, and on the family table. While tuna flesh is widely appreciated, it does contain a natural toxin known as methylmercury, which is generating a considerable number of questions and concerns. A multidisciplinary study (Houssard et al. 2019) has accurately mapped the methylmercury content of a number of tuna species of the central and southwest Pacific for the first time. This is the zone in which more than half of the world’s tuna is caught and subsequently exported, ending up on the plates of consumers. This study reveals that the methylmercury content of tunas depends not only on the size and species of the fish, but also on where they were caught. These results enable us to inform and advise tuna lovers.
To address the potential health risks associated with the naturally occurring methylmercury, the French Institute of Research for Development (IRD), the Pacific Community (SPC) and the University of New Caledonia (UNC) undertook research on the mercury content of a number of tuna species in the western and central Pacific Ocean. Using specimens collected since 2001 by Pacific national observer programmes and stored in the tuna tissue bank managed by SPC (Sanchez et al. 2014), IRD has in recent years performed more than 1000 muscle tissue mercury content assessments on yellowfin, bigeye and albacore tunas.
Importance of landed fish size
Based on flesh samples from tuna captured in a large area stretching from Australia to French Polynesia, it came as no surprise that the highest mercury concentrations are found in the largest tunas (Fig. 1). In tuna flesh, mercury essentially occurs as methylmercury, which is the organic form of mercury that builds up naturally as tuna grow older and bigger; this process is known as bioaccumulation. Methylmercury is eliminated by marine organisms at a slower rate than it is accumulated (see Box 1). For the great majority of fish tested, the values recorded remain lower than the recommended threshold of 1 mg of mercury per kg of fish (wet weight) (USFDA 2006; WHO/UNEP DTIE Chemicals Branch 2008), especially for tuna under 1 m in length (Fig. 1). It has also been observed that this threshold may be exceeded in some albacore and bigeye tunas over 1 m in length, while this is only infrequently true of yellowfin tunas over 1.2 m in length.
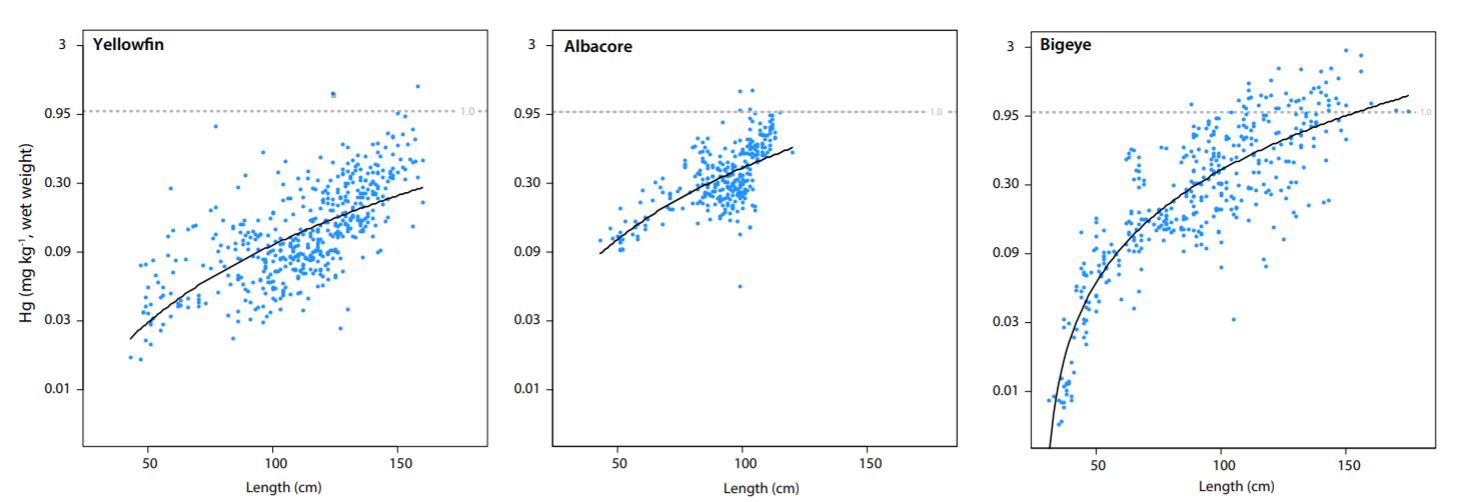
Figure 1. Mercury content trends as influenced by fish size in yellowfin, albacore and bigeye tunas in the western and central Pacific. The dotted horizontal line shows the recommended limit of 1 mg of mercury per kg of fish (wet weight).
Importance of depth and fishing zone
Researchers for the present study have also observed variations in mercury content between species, with bigeye tuna showing higher concentrations than yellowfin or albacore tunas (Fig. 2A). This difference between species can be explained by lifespan variations, different feeding habits and different physiological capacities, which, in particular, influence the respective depths at which they feed. Bigeye tuna live longer than the other two species and will, therefore, accumulate more mercury throughout their lifetime. In addition, bigeye tuna can dive deeper than the two other species, thus spending more time in the zone where natural methylmercury production in the ocean is highest (see Box 1). Bigeye tuna, therefore, show higher methylmercury concentrations than both albacore tuna, whose habitat is shallower, and yellowfin tuna, which tend to swim closer to the surface (Fig. 2B).
In addition to the effect of size and interspecific differences among tunas, our research made it possible to go even further by demonstrating that significant geographical differences also exist. In fact, within the same species, bigeye tuna for example, mercury content levels may vary by a factor of two or three or even more, depending on location. Around New Caledonia and Fiji for example, mercury levels are higher than they are at the equator (Fig. 3). Electronic tuna tagging research results (Evans et al. 2008; Fuller et al. 2015; Houssard et al. 2017) have shown that bigeye tuna dive deeper in New Caledonia than they do at the equator, again demonstrating that the deeper a tuna’s habitat, the higher the methylmercury concentrations it contains, because it feeds within a habitat where methylmercury production is higher (see Box 1).
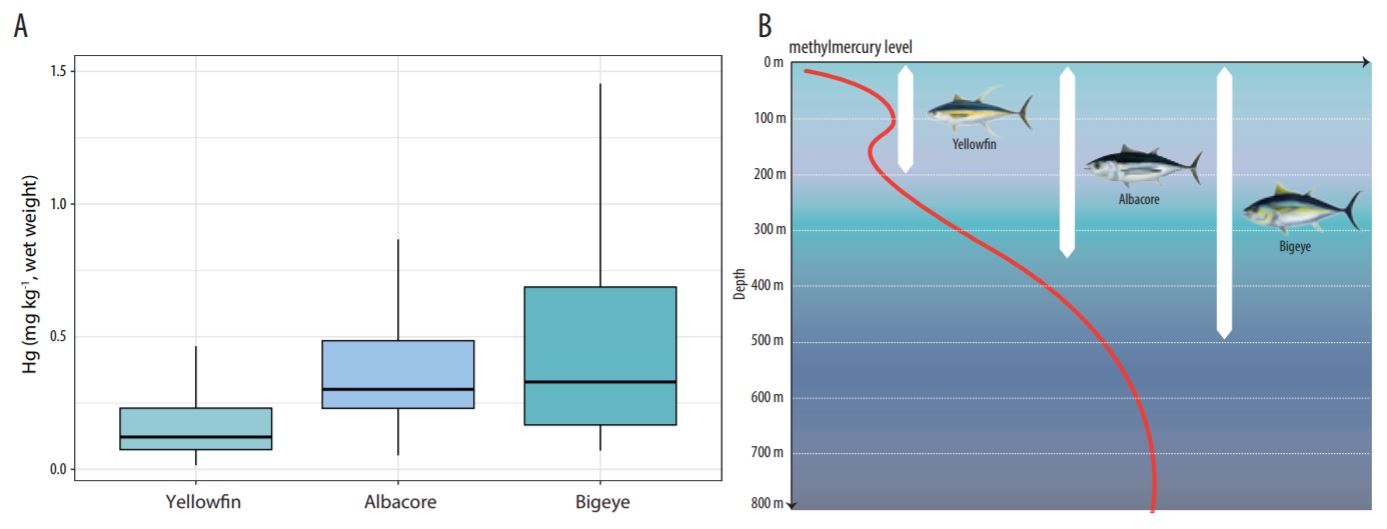
Figure 2. A) Median mercury content levels in yellowfin, albacore and bigeye tunas in the western and central Pacific, and B) representation of the vertical habitat of tunas, with the curve of methylmercury content in the water in relation to depth.

Figure 3. Geographic distribution of mercury levels for yellowfin
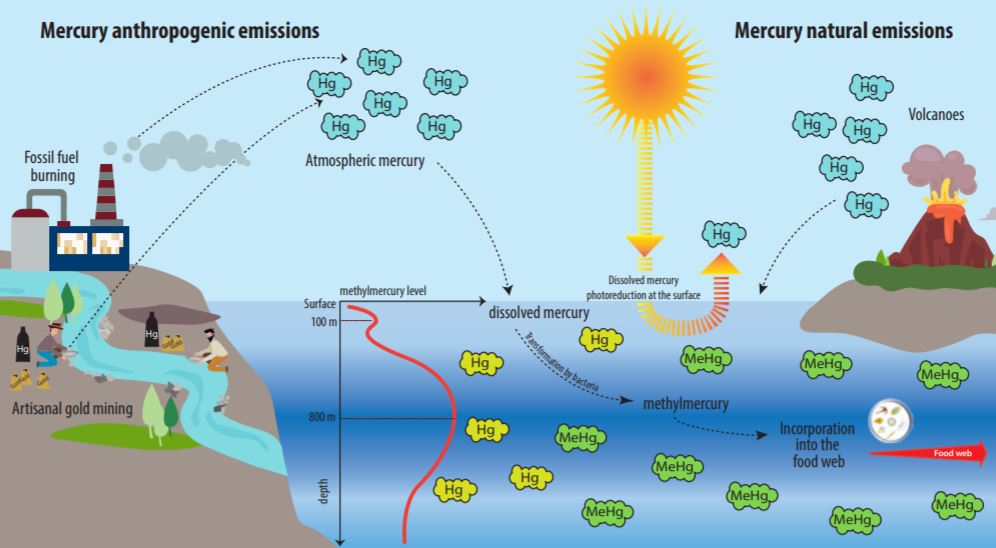
Box 1
Where does the methylmercury in the ocean come from?
Mercury is emitted into the atmosphere through natural sources such as volcanoes, but more extensively through human activities such as burning coal and fossil fuels, industrial waste, and small-scale gold mining. The gaseous form of mercury in the atmosphere is gradually deposited into the oceans in the form of dissolved mercury, or methylmercury. Human-caused mercury emissions have been, for example, responsible for a threefold increase in mercury concentrations dissolved in the surface layers of the world’s oceans since the industrial revolution (Lamborg et al. 2014). A fraction of the dissolved mercury is naturally converted into methylmercury by sulphate-reducing bacteria, in which case the process is referred to as mercury methylation. This conversion is particularly intense in the less oxygenated deeper ocean waters (between depths of 400 m and 800 m). Also, in the surface layers, the dissolved methylmercury and mercury are degraded by light and re-emitted into the atmosphere in a gaseous mercury form (photo-reduction process). The production of methylmercury in the oceans, therefore, depends on the balance between methylation, which is more intense in less oxygenated zones (deeper ocean layers), and photo-reduction, which is more intense in surface ocean layers. The balance between these reactions explains the trend towards an increase in methylmercury concentrations with depth.
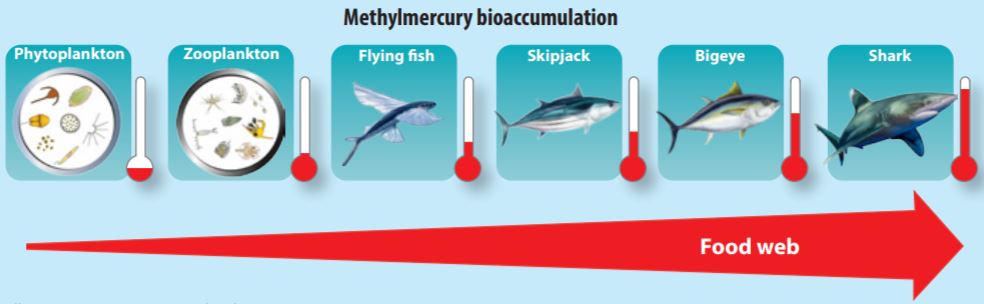
This methylmercury is highly bioavailable for ingestion and fixing by the living organisms at the base of the food web. Its concentration increases naturally, by accumulation, because it is only eliminated in very small quantities by organisms, from the very first stages in the food web (plankton), up to the top predators (tuna and sharks), which contain the highest methylmercury levels. There are, however, many more grey areas in the ocean mercury cycle.
Mercury limits are infrequently exceeded
Despite the combined influence of size, species and feeding depth, the recommended mercury limits (1mg kg-1 wet weight) are infrequently exceeded. Only 1% of yellowfin and albacore tuna catches and 11% of bigeye tuna landings showed concentrations higher than the maximum recommended levels. Values over the maximum recommended level were mostly for larger specimens (1 m or more in length). Bearing in mind tunas’ demonstrated nutritional benefits, with special reference to omega-3 fatty acids and essential elements (such as selenium) that reduce the risk of some cardiovascular diseases, there is no justification for any ban on eating tuna; all that is required is a recommendation to consume it in moderation as per established guidelines. Relevant authorities in every country publish recommendations on the quantity and species of tuna that can be consumed weekly with regard to relevant population groups (e.g. pregnant women, young children). The Government of New Caledonia and its Health and Social Affairs Department, in cooperation with the researcher team involved in the present study, produced and disseminated leaflets setting out the amount of tuna that can be consumed weekly and by population group to keep the public in New Caledonia informed.
Box 2
The Minamata Convention, or how to restrict mercury pollution
The international Minamata Convention, which came into force in August 2017, pursues the goal of controlling and reducing anthropogenic mercury emissions into the atmosphere. This convention is named after the town of Minamata in Japan, where a petrochemical factory leaked industrial methylmercury, from the production of acetaldehyde, for more than 30 years, between 1930 and 1960. This pollution poisoned thousands of people who endured severe neurological impacts. The health risks are particularly high for foetuses and young children. Many countries have ratified, or are in the process of ratifying, the Minamata Convention and are, therefore, committed to reducing mercury pollution by controlling and better managing the use of mercury in small-scale gold mining or by reducing emissions into the atmosphere.
New research under way in the three oceans
If we compare mercury content levels in the Pacific with available data in the literature for other oceans (Indian, Atlantic, North Pacific) (see Houssard et al. 2019), the levels fall within the same value ranges for bigeye tuna and, indeed, are even lower when it comes to yellowfin and albacore tunas of a similar size (Fig. 4). These studies are, however, based on limited datasets and show major variations around mean values. In order to confirm these results, our team has begun a large-scale study with supplementary high-spatial-resolution analysis to determine mercury levels in every ocean.6 Mercury-specific isotope markers will, for example, be used to try and understand what the various mercury sources are (natural or human caused) and how and where they bioaccumulate in top predators, in an effort to determine the risks and benefits of consuming tuna caught in a particular place.
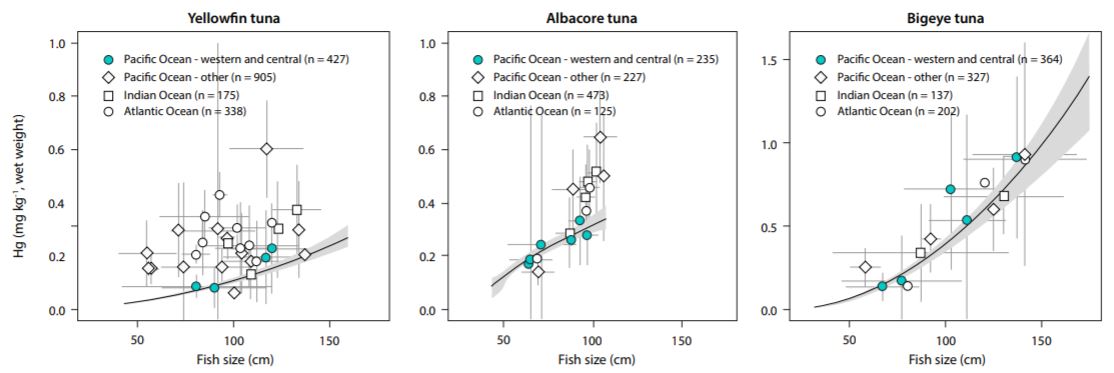
Figure 4. Trends in mercury content by fish size for yellowfin, albacore and bigeye tunas in the three oceans. The mean values from our study, which originate in various parts of the western and central Pacific, are shown in colour, with the general trend (black curve) and variability around that trend (shaded zones) also shown. The mean values from the scientific literature (see Houssard et al. 2019), which originate from other parts of the Pacific, Indian and Atlantic oceans are represented by white symbols. Horizontal and vertical lines show the range of values on either side of the mean. Figures in brackets represent the number of specimens tested in order to calculate mean values.
References (page 5)
Author:
- Anne Lorrain, Marine Ecology Research Scientist, Laboratoire des Sciences de l’Environnement Marin (LEMAR), French Institute of Research for Development (IRD). Email: [email protected]
- David Point, Marine Ecology Research Scientist, Laboratoire Géosciences Environnement Toulouse (GET), French Institute of Research for Development (IRD). Email: [email protected]
- Valérie Allain, Senior Fisheries Scientist (Climate Change and Ecosystem Analysis), Oceanic Fisheries Programme, Pacific Community. Email: [email protected]
For more information, please visit SPC Fisheries Newsletter #158 webpage