Cartography is an integral part of household census and survey cycles. Traditionally, maps have been used to help with field enumeration and to spatially represent aggregated results and indicators for analysis and dissemination.
In the late 1990s and early 2000s, with the gradual introduction of technologies such as Geographic Information Systems (GIS) and Global Positioning Systems (GPS), we saw a major improvement in the way in which geographic census unit frameworks and household locations were defined and located in space. This valuable geographic information enhanced the way census and surveys were designed and planned.
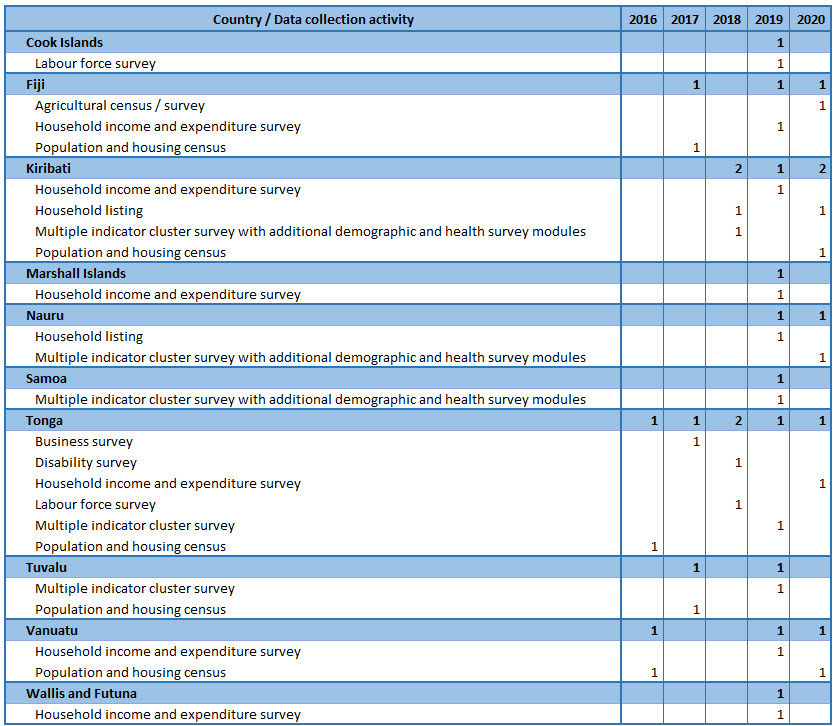
In 2016 Tonga and Vanuatu were the first countries in the region to replace paper questionnaires with Computer Assisted Personal Interviewing (CAPI) to carry out their respective population and housing censuses. Since then, other countries in the region have been integrating CAPI technology into their data collection.
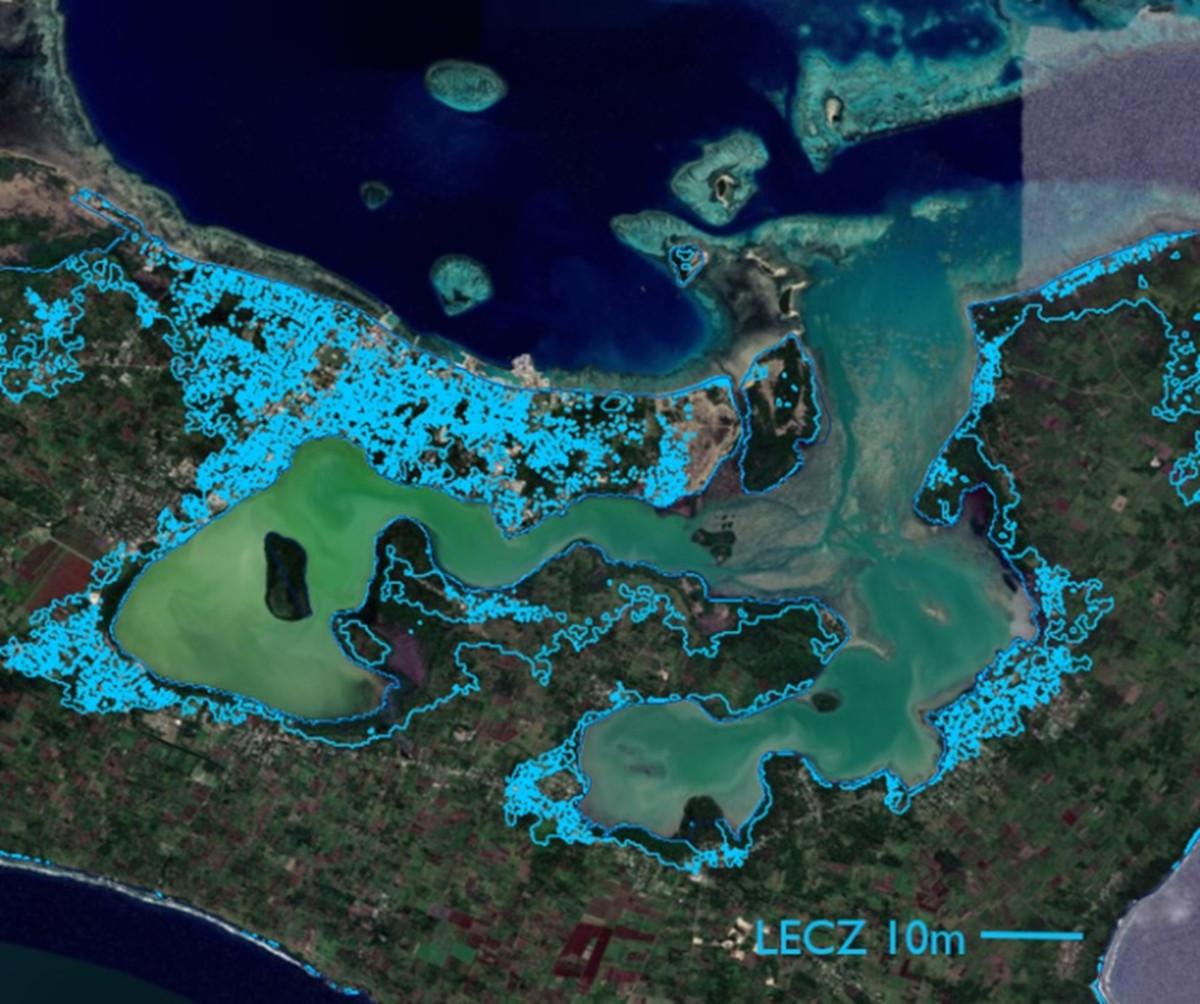
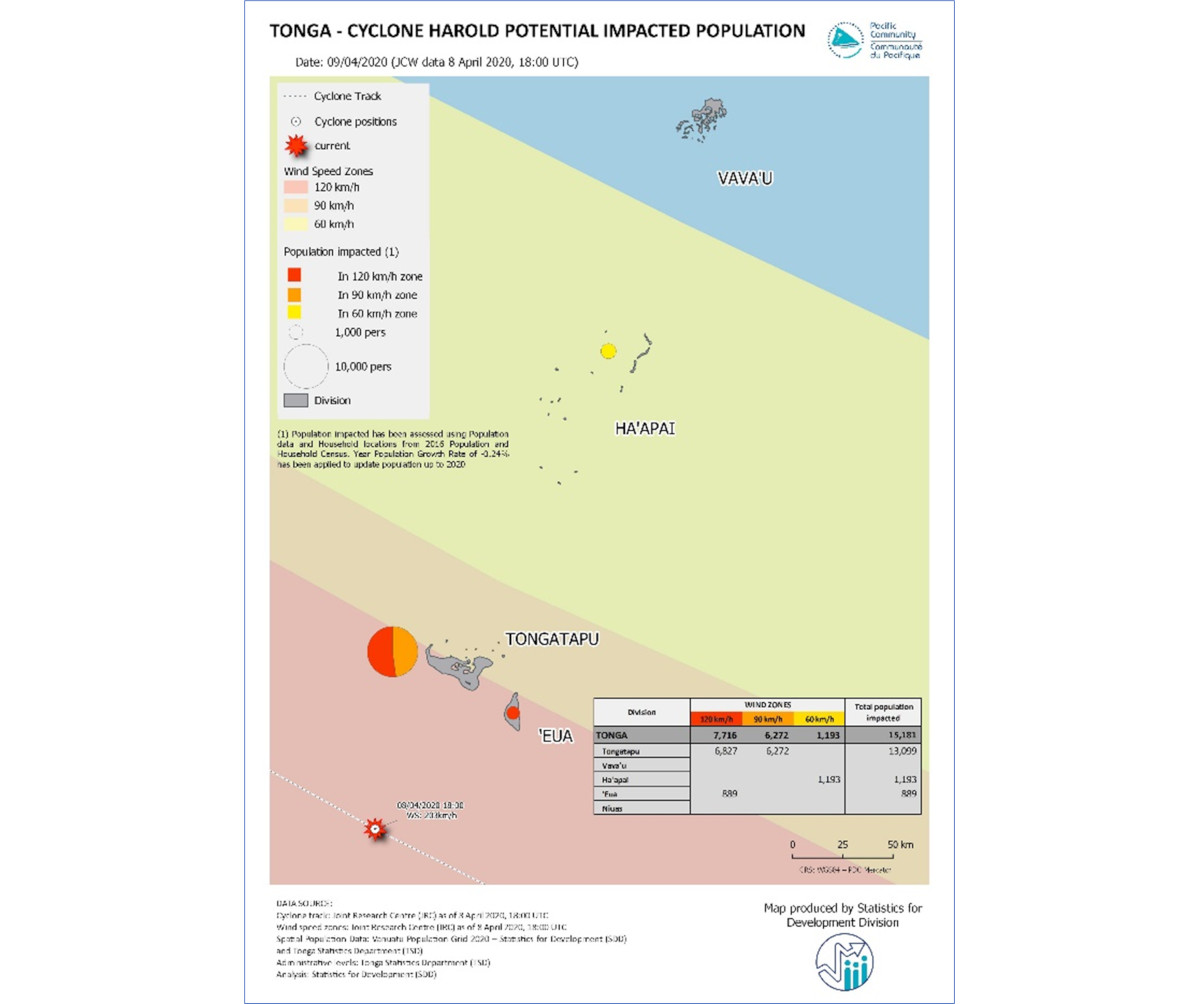
From a geospatial perspective, CAPI systems have brought two main improvements. First, the spatial information is now integrated within the census/survey database, facilitating field work and data monitoring in real time. Secondly, the robust connection between the geographic and statistical information at household level opens a range of new opportunities to undertake extensive analysis related to disaster management, climate change, water and sanitation, food security and coastal fisheries, among other areas. For example, by combining georeferenced population data from censuses with elevation models or maps of areas vulnerable to cyclones, we can describe potential effects on populations in the event of sea level rise (left) or natural disaster (right).

Nowadays it is easier to implement geospatial technologies given that there are a wide variety of open-source options available, such as Survey Solutions and CSPro for CAPI, or QGIS and gvSIG for GIS. Open-source alternatives are not only accessible, as there are no costs or licenses associated with them, but they come with a great variety of generally free documentation and learning resources.
The use of maps to visualize statistical data can be used to increase the readability and usability of data to communicate information clearly and efficiently. In addition, with the use of maps, it is possible to demonstrate the relationship between data and its location in space, helping determine if certain trends or patterns are spatially correlated.
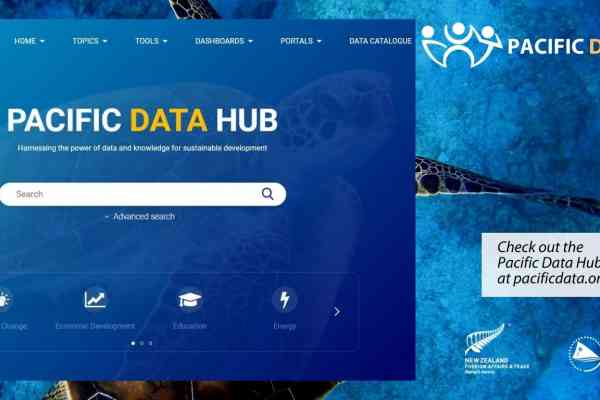
However, none of the aforementioned applications can be carried out if the necessary datasets are not readily available. Tools such as the Pacific Data Hub, PacGEO and OpenStreetMap Data Pacific have been set up to provide easier access to spatial and statistical data for the Pacific region.
For non-GIS users, there are a series of intermediate tools available to explore data through interactive maps. These include web mapping tools, such as PacificMap and the country-specific POPGIS, which provide user-friendly interfaces that help users extract and map data according to their needs.