Noumea
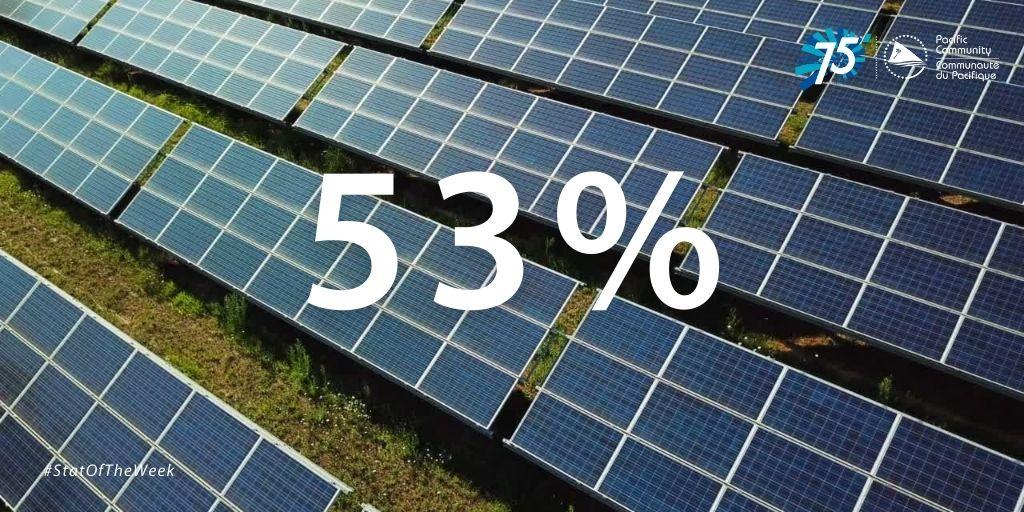
Did you know? 53% of Papua New Guinea's total final energy consumption comes from renewable sources.
The renewable energy share in total final consumption is the percentage of final consumption of energy that is derived from renewable resources. Humanity is using up the world’s resources faster than they can naturally recover (United Nations). On World Environment Day, let's encourage climate action. (Source: UNEP)
We have Only One Earth. Let's take care of it.
Sustainable Development Goal 07 - Affordable and Clean Energy
| Pacific Island Countries and territories | 2010 | 2011 | 2012 | 2013 | 2014 | 2015 | 2016 | 2017 | 2018 | 2019 | 2020 | 2021 |
|---|---|---|---|---|---|---|---|---|---|---|---|---|
| American Samoa | n/c | n/c | 0.09 | 0.16 | 0.16 | 0.17 | 0.21 | 0.35 | 0.35 | 0.36 | 0.38 | 0.39 |
| Cook Islands | 7.25 | 6.52 | 6.17 | 6.32 | 6.26 | 7.18 | 100 | 8 | 9.39 | 9.02 | 9.94 | 8.76 |
| Fiji | 27.95 | 33.38 | 33.26 | 32.81 | 33.17 | 32.74 | 27.68 | 28.55 | 25.8 | 26.48 | 31.79 | 29.7 |
| Micronesia (Federated States of) | 1.95 | 1.57 | 1.42 | 1.41 | 1.51 | 1.71 | 1.87 | 1.72 | 2 | 1.98 | 2.03 | 2.08 |
| Guam | 0.47 | 0.49 | 0.53 | 0.59 | 0.67 | 2.32 | 4.38 | 3.9 | 4.49 | 4.47 | 4.58 | 4.5 |
| Kiribati | 50.14 | 50.52 | 48.73 | 46.16 | 47.98 | 47.48 | 48.1 | 42.51 | 42.31 | 42.19 | 42.24 | 42.23 |
| Marshall Islands | 13.72 | 12.35 | 12.03 | 12.37 | 12.15 | 11.72 | 12.13 | 12.01 | 12.03 | 12.08 | 11.97 | 12.06 |
| Northern Mariana Islands | n/c | n/c | n/c | n/c | n/c | n/c | n/c | n/c | n/c | n/c | 0.32 | 0.48 |
| New Caledonia | 4.85 | 5.93 | 6.17 | 6.56 | 4.29 | 5.09 | 3.7 | 5.1 | 4.63 | 5.24 | 6.06 | 8.33 |
| Nauru | 0.03 | 0.05 | 0.07 | 0.06 | 0.05 | 0.1 | 0.18 | 0.6 | 0.66 | 0.59 | 1.34 | 1.65 |
| Niue | 1.37 | 1.27 | 1.19 | 1.17 | 1.16 | 1.11 | 1.05 | 1.06 | 3.02 | 3.01 | 3.08 | 3.01 |
| French Polynesia | 7.47 | 6.89 | 6.64 | 6.49 | 7.45 | 7.83 | 8.08 | 8.07 | 7.71 | 7.65 | 8.24 | 7.44 |
| Papua New Guinea | 55.25 | 54.73 | 55.45 | 58.34 | 56.93 | 55.33 | 54.81 | 54.68 | 53.38 | 53.18 | 53.62 | 54.5 |
| Palau | n/c | n/c | n/c | n/c | 0.27 | 0.37 | 0.57 | 0.56 | 0.59 | 0.86 | 0.87 | 0.87 |
| Solomon Islands | 45.07 | 43.61 | 43.82 | 41.83 | 45.89 | 48.64 | 48.7 | 48.98 | 48.64 | 48.36 | 49.03 | 49.13 |
| Tonga | 1.01 | 1.14 | 1.15 | 1.58 | 1.7 | 1.94 | 2.03 | 1.96 | 1.78 | 1.77 | 1.89 | 1.77 |
| Tuvalu | 0.45 | 0.21 | 0.27 | 0.7 | 0.65 | 2.98 | 7.27 | 6.98 | 6.36 | 6.32 | 5.04 | 5.04 |
| Vanuatu | 38.08 | 35.75 | 38.98 | 40.92 | 31.51 | 35.62 | 33.15 | 35.69 | 29.7 | 31.63 | 26.02 | 24.64 |
| Wallis and Futuna | 3.67 | 3.62 | 3.78 | 3.96 | 4.01 | 3.99 | 3.81 | 3.84 | 3.72 | 3.58 | 3.32 | 3.34 |
| Samoa | 41.93 | 40.64 | 40.21 | 42.64 | 41.42 | 37.06 | 36.8 | 35.79 | 36.64 | 34.21 | 35.64 | 35.95 |
Blog Category
Did you know?
Division
Statistics for Development
Melanesia Regional Office
Pacific Data Hub